Actin Images
High Resolution Imaging of the Yeast Actin Cytoskeleton Rhodamine-phalloidin labeling of Saccharomyces cerevisiae throughout the cell cycle
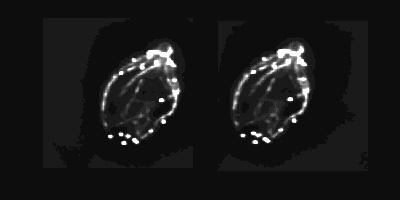
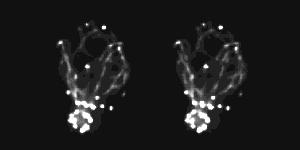
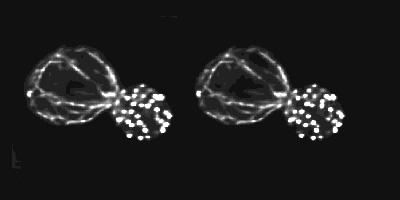
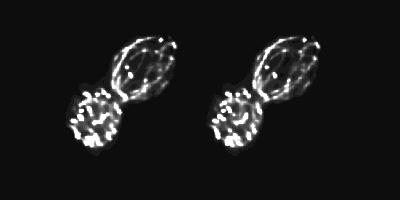
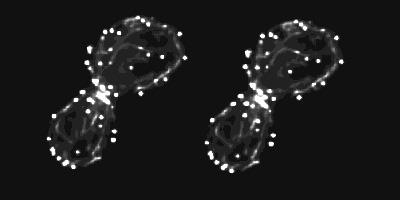
The following images were obtained by labeling the actin cytoskeleton of wild type, diploid yeast cells with rhodamine conjugated phalloidin. We recently published these images in Molecular Biology of the Cell, the text of this paper and the images are available through the journal's website. Since phalloidin binds specifically to F-actin verses G-actin, only filamentous actin is visualized by this method. Note that in these images we have visualized only two of the three filament based structures visible in S. cerevisiae: the cortical actin patches and the actin cables which consist of bundled actin filaments. At the time these images were made we did not visualize the cytokinetic ring which has since been described by Rong Li's and John Pringle's laboratories. Actin cortical patches are invaginations of the plasma membrane around which actin filaments and actin binding proteins are organized. The ultrastructure of the actin cortical patches has been well described by Jon Mulholland. Work by Tim Doyle in David Botstein's lab and work by John Cooper's lab has shown that actin cortical patches are highly mobile, moving with rates of up to 1 micron per second.
We have documented how the 3-dimensional organization of the actin cytoskeleton changes through the cell cycle. This was made possible through the use of a deconvolving microscope and image analysis software from API DeltaVision. To view full size images, click on a cell cycle stage in the diagram to the right. You will jump to a stereo pair representing a 3D projection of that stage. In addition, you may download a QuickTime movie in which the 3D projection of the cell is rotated around its Y-axis.
Bud site selection

[Cytokinesis] [Back to cell cycle diagram]
Bud Emergence
[Cytokinesis] [Back to cell cycle diagram]
Small bud
[Cytokinesis] [Back to cell cycle diagram]
Large bud
[Cytokinesis] [Back to cell cycle diagram]
Preparing for Cytokinesis
[Large Bud] [Back to cell cycle diagram]
Image manipulation: After data acquisition, projections were generated using the DeltaVision image analysis software. These projections were converted into stereo pairs using the same program. Movies were made by manipulating rotated projections, generated in the DeltaVision package, with NIH Image, and importing into Adobe Premier.